What is the IMF Dollar Exchange Rate Forecast? How to Calculate? Applied Example

In the World Economic Outlook Report, the IMF published current economic data for 2022, 2023, 2024, 2025, 2026 and 2027 and its forecasts for the coming years.

In this article , we will calculate the IMF’s USD/TRY exchange rate forecast for 2022, 2023, 2024, 2025, 2026 and 2027,  based on the purchasing power parity (PPP) estimates in the IMF World Economic Outlook Report  .

How far does the dollar go?

Should we buy dollars? How far does the dollar go? What happens to the dollar? What will be the dollar exchange rate at the end of 2022? What will happen to the dollar in 2023? If you want to give a short and clear answer to those who ask, you can boldly state the forecast figures of the IMF World Economic Outlook Report, which has objective and detailed data. After all, the huge IMF forecast

IMF global economy forecasts are invaluable data for you to compare with the latest dollar comment headlines or optimistic expert comments on the internet.

Why is the IMF Dollar Rate Forecast Important?

In our analyzes that involve predictions about future periods, such as investment plans, budget projections, cash flow projections in companies we work with, or especially when evaluating our contracts in foreign partnerships, we have to use objective dollar exchange rate estimates for future periods. In this respect, we benefit from the IMF “World Economic Outlook Report” estimates, which are created with very valuable and detailed economic data.

Let’s examine the data we will use and the links we can access when calculating the dollar exchange rate forecast;

What is the World Economic Outlook Report?

World Economic Outlook Report ; It is a report prepared by IMF economists that provides a detailed analysis of global economic developments in the near and medium term, taking into account the problems affecting economies, and is generally published twice a year, in April and October. Here you can access current and forecast data on many economic data.

Click to access the April 2022 World Economic Outlook Report;

https://www.imf.org/-/media/Files/Publications/WEO/2022/April/English/text.ashx

What data should I use to calculate dollar exchange rate estimates?

There are three data we can obtain from the World Economic Outlook Report to calculate the dollar exchange rate estimate: Purchasing power parity (PPP), Gross domestic product (GDP) (US Dollar, Billion), Gross domestic product (GDP) (Purchasing Parity)

What is Purchasing Power Parity (PPP) (Implied PPP Conversion Rate (National Currency Per International Dollar))?

Purchasing power parity (PPP) is a parity that relates changes in the nominal exchange rate between two countries’ currencies to changes in the countries’ price levels. It can be thought of as a common currency that reflects and compares the absolute purchasing power between countries. PPP is a good alternative for comparison, especially when official exchange rates are artificially manipulated and deviate significantly from their long-term equilibrium.

Click to access IMF Purchasing Power Parity (PPP) data;

https://www.imf.org/external/datamapper/PPPEX@WEO/OEMDC/ADVEC/WEOWORLD

What is Gross Domestic Product (GDP) (US Dollars) (GDP, Current Prices (Billions Of US Dollars))  ?

Gross domestic product (GDP) is an economic measure that represents the total market value of all final products produced over a period of time, usually a year.

Click here to access IMF gross domestic product data in US Dollars;

https://www.imf.org/external/datamapper/NGDPD@WEO/OEMDC/ADVEC/WEOWORLD

What is Gross Domestic Product (GDP, Current Prices (Purchasing Power Parity; Billions Of International Dollars)) ?

GDP represents the total value in PPP terms of final goods and services produced in a country over a given period of time at current prices (purchasing power parity).

Click here to access IMF Gross Domestic Product data in Purchasing Parity (PPP) terms;

https://www.imf.org/external/datamapper/PPPGDP@WEO/OEMDC/ADVEC/WEOWORLD

Now let’s calculate the IMF exchange rate forecasts

IMF Exchange Rate forecast calculation steps;

  1. The 3 relevant data are downloaded from the IMF database.
  2. The gross domestic product in Turkish Lira is obtained by multiplying the relevant year’s gross domestic product in purchasing parity and the relevant year’s purchasing parity   . 
  3. The gross domestic product (GDP) in Turkish Lira that we obtained is divided by the gross domestic product (GDP) in US Dollars of the relevant year that we obtained from the database, and the IMF exchange rate forecast for the relevant year is shared with you.

You can use the following formulas when using data;

GDP (TL) = GDP (PPP)

USD/TRY=GDP (TL)/GDP (US Dollar)

GDP (TRY) = GDP, current prices (Purchasing power parity; billions of international dollars)

Exchange Rate=GDP (TRY) / GDP, current prices (Billions of US dollars)

APPLICATION;

Since the data is available in English on the IMF website, the examples are taken as written on the website, which will help you find the data more easily.

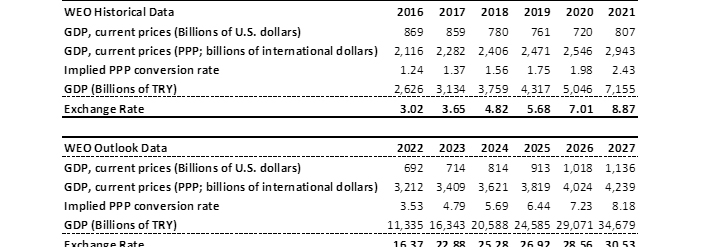
2022 Average  USD/TRY Parity Calculation;

2022 GDP, current prices (Purchasing power parity; billions of international dollars): 692.38

2022 Implied PPP conversion rate (National currency per international dollar): 3.53

2022 GDP (TRY): 11,335

2022 GDP, current prices (Billions of US dollars): 3.212

2022 USD/TRY Exchange Rate: 16.37

According to the IMF World Economic Outlook Report (WEO), Average US Dollar Exchange Rate (USD/TRY) Estimates are as follows by Years; 

16.37 for 2022, 22.88 for 2023, 25.28 for 2024, 26.92 for 2025, 28.56 for 2026, 30.53 for 2027.

You can use this data until a new economic report is published in October.

I hope the data will help you in your work.

WHAT IS BEPS

BEPS has been translated into Turkish as Base erosion and profit shifting. BEPS is a project of OECD (Organization for Economic Co-operation and Development) consisting of 15 separate action plans, that is, actions regarding measures that can be taken on 15 different taxation issues that cause tax erosion. 

BEPS in short; It is a project that fights to prevent multinational companies (MNE – multinational enterprise) from causing tax losses or tax avoidance by taking advantage of the differences in the local tax regulations of the countries.

WHAT IS THE PURPOSE OF BEPS?

With the BEPS plan, multinational enterprises’ company information, activities, risks, revenues and assets are collected in a single system. The main purpose of the BEPS plan is to eliminate tax inconsistencies from country to country and prevent companies from shifting their profits from a country with a high corporate tax to a country with a low tax rate, thus preventing money laundering. In this project, the priority of essence, transparency and consistency are at the forefront. The plan is to limit opportunities for international tax avoidance.

In addition to preventing both double taxation and double taxation, the project also prevents countries from affecting the investment potential of other countries by lowering tax rates to attract investment. Significant changes are being made that will affect the organizations of multinational companies that transfer their profits to tax havens.

There are 3 types of reporting obligations within the BEPS action plan.

These;

1.Master File: This is the report that includes the organizational structure of the group, the description of its commercial activities, its intangible assets, intra-group financial transactions and the financial and tax situation of the group.

2. Country Report (Local File): It consists of 3 separate reports.

Transfer Pricing Report: This is the annual transfer pricing report that has been in practice in Turkey since 2007, showing the transactions made by the Group’s Turkish resident enterprise with all related companies. Domestic and international related transactions of taxpayers registered with the Large Taxpayers Tax Office and corporate taxpayers operating in free zones; Other corporate taxpayers are required to prepare an annual transfer pricing report covering only their foreign-related transactions.

Annex 2 transfer pricing form within the scope of the Country Report: “Form Regarding Transfer Pricing, Controlled Foreign Institution and Thin Capital”.

Annex4 transfer pricing form within the scope of the Country Report: Transfer Pricing Form for Transactions with Related Parties.

3.Country Based Reporting (CbCR): 76 countries have signed it so far . http://www.oecd.org/tax/automatic-exchange/about-automatic-exchange/CbC-MCAA-Signatories.pdf   Turkey has not signed yet. Once signed, country-based reporting information can be mutually shared with other country tax administrations within the framework of bilateral and/or multilateral international agreements to which Turkey is a party. The list of countries that are parties to the agreements in question is announced by the Administration.

BEPS Examples

For the OECD’s BEPS movement, the BEPS scandals of the last decade have been a driving force. 

Base erosion is a loss of revenue for states. It is estimated that annual tax revenue losses range from US$100 to US$240 billion (4-10% of global revenues from corporate income tax) due to profits being transferred from country to country around the world.

The largest firms in the world are generally US multinationals, which avoid the high (35%) corporate tax rate in the US. To avoid this, they often set up a company in a country with a lower corporate tax rate. Let’s take a look at BEPS in practice, that is, examples of base erosion that are not very fair;

Double Irish

It is the largest tax avoidance structure in history. Double Irish is a BEPS structure used by US companies in Ireland (Apple, Google and facebook etc). For example, Google was founded in Ireland and its headquarters in Bermuda. While this company of Google was considered Irish according to America, it was Bermudian according to Ireland. Meanwhile, the tax rate in the USA is 35% and in Ireland it is 12.5%. Google clearly stated that the reason for this practice was to ‘take advantage of the low corporate tax rate in Ireland’. However, the income generated by Google could be transferred to Bermuda without being taxed in both the USA and Ireland. It is obvious that there is nothing illegal here, but there is also no fair taxation.

Intangible asset transfer

It is the transfer of intangible assets, such as patents and trademarks, whose value cannot be determined clearly and precisely, or whose determination is difficult and not objective, from a country in a tax haven to a country with a high tax rate that is not in a tax haven. In other words, this is the practice of selling intangible assets and not adding the income to the tax base of the company in the tax haven, while the company in the country with high tax rates can deduct this purchase from the tax base.

Securitization

SPV (special purpose vehicle) is an emerging debt-based BEPS vehicle. It is preferred to be established in countries with tax advantages. Usually, financiers establish the SPV and the SPV acquires shares of the target company by obtaining debt from these financiers. SPV benefits from the tax shield of the debt it uses and many tax advantages in the legislation. Currently, $10 trillion in global securities have been created through SPVs, which are obscure and use asset-backed securitization (ABS) to create artificial debt structures.

Investment Projects Profitability Analysis

In this article, general lines that should be taken into consideration in the profitability analysis of investments to be made, especially in an economy with inflation and increasing exchange rates, are stated. This article can provide you with a vision about the acceptability of investment projects.

In this article, “How can I decide whether investment projects create financial value? What discount rate should I use when discounting expected future cash flows in investment projects to the present? What is the risk-adjusted discount rate? What is the risk-free interest rate? What is the risk premium? What is the beta coefficient? You can find answers to questions such as.

ABOUT THE ACCEPTABILITY OF INVESTMENT PROJECTS;

In the profitability analysis of investments or projects, the value of the investment is equal to the net present value of the expected cash flows.

If the present value of the cash we will obtain in the future from the projects is greater than the current cash outflow, the projects result in net cash inflow and are profitable projects.

A project creates value only if it generates higher returns than similar investments in financial markets.

In the simplest terms, if the investment we make with some money we have provides a return higher than the market interest rate, this investment creates financial value.

If we invest some money for interest, we can find the future and present value of our money by using the formulas Future Value = Principal x (1 + Interest Rate) Maturity and Present Value = Future Value / (1 + Interest Rate) Maturity.

Net Present Value Method

We use the following formula to find the net present value of the future cash flows of our investments.

NPV = Net Present Value

NA1,NA2… = Cash Flow at the end of the 1st Period, Cash Flow at the end of the 2nd Period…

Discount Rate (r) = Risk-free rate of return + Risk Premium

The discount rate of the investment is equal to the return that could be earned on an investment with equal risk in the financial markets. However, we often have to include risk in this discount rate.

Exchange rate risk, inflation risk, geographical risk, country risk or other uncertain risks cause uncertainty in investment profitability, so the risk should be included in the discount rate we use to discount cash flows, and the Risk Adjusted Discount Rate should be used.

As the risk increases;

  1. While the present value of the project is constant, expected future cash flows increase,
  2. If the expected future cash flows of the project are certain, that is, fixed, the present value of the project decreases.
  • If we give an example of the first item; While the present value of a factory that produces and sells essential consumer goods as a monopoly is constant, we expect future cash flows to increase.
  • If we give an example of the second item; In an environment where exchange rate and inflation risks are constantly increasing, we expect the expected current return of committed, progress-based projects to decrease.

The main logic for us to understand NPV calculations is as follows; Let’s say we have two service contracts with the same contract price and the same contract period. The one with higher risk has a lower present value. or when the present value is fixed, the future value is higher, that is, among two contracts with the same present value and the same amount and the same duration, the expected future return of the one with higher risk will be higher.

Risk Adjusted Discount Rate can be applied to projects with increasing risk, but if the risk decreases over time, we may calculate the value of the project lower than it should be, which will mislead us.

HOW DO I CALCULATE THE DISCOUNT RATE?

According to the Capital Asset Pricing Model (CAPM), the discount rate is found as follows;

  • Discount Rate (r) = (Risk-free interest rate) + (Market risk premium) x (Beta)
  • Discount Rate (r) briefly consists of the sum of the Risk-free return rate and the Risk Premium.

So, let’s talk about how to determine the risk-free rate of return and risk premium.

WHAT IS THE RISK-FREE INTEREST (RETURN) RATE?

The risk-free rate of return is the interest rate in each country’s currency of the central bank, which has the authority to create that currency. However, since the interest rates of central banks are short-term and are not applied for every maturity, the yields of treasury bills or government bonds in that currency corresponding to the maturity are accepted as the risk-free rate of return in practice. The interest rate valid throughout the life of the asset is the value found by using the 10-year government treasury bonus or bond interest rate in a 10-year project, which is generally valid for companies throughout the life of the project. If we are using a foreign currency, it is the value found using the state treasury bonus or bond interest rate to which the currency belongs. For example, nowadays (November 2018) TR 10-year bond interest rates are 16.69 and US 10-year bond is 3.

WHAT IS RISK PREMIUM?

Risk premium is the value found by multiplying the difference between the market rate of return and the risk-free rate of return by beta.

In other words, the Risk Premium is the risk of the project relative to the general market index, it is the measure that shows the relationship between the changes in the project returns depending on the changes in the return rates of the market portfolio.

For example;

If we have a project with a risk-free rate of return of 16% and a market interest rate of 24%, with a beta of 1.5, the risk premium is (24% – 16%) x 1.5, or 12%.

WHAT IS BETA COEFFICIENT?

Beta (β) shows the relationship of the relevant project (or sector) with market movements.

It is the calculation of how risky the market risk is against the preferred project, or it shows how risky the preferred project is compared to the market.

For example, if the market’s beta is 1 and our project’s beta is 2, when the market gains 10% value, our project gains 20% value, and the same is true when there is a decrease. If the market has a beta of 1 and our project has a beta of 0.1, when the market gains 10% in value, our project’s return increases only by 1%.

Beta is calculated by dividing the covariance between the return of the project and the return in the market (Covariance examines the changes of two variables together) by the variance of returns in the market (variance is the average square of the distance between the average value and each value in the population).

While calculating covariance and variance, in the simplest form, we can calculate covariance in Excel by putting the interest returns of the market and the expected returns of the project in the same periods side by side, and we can also calculate the variance for the returns of the market in the same periods.

Beta coefficient shows the sensitivity (volatility) of the project to market risk.

  • If ß=1, the movement of the project return is the same as the market (average risk).
  • If ß<1, the movement of the project return is slower than the market (less risky, low volatility).
  • If ß>1, the movement of the project return is faster than the market (more risky, high volatility).

However, it should not be forgotten that we reject the social responsibility of businesses by saying that investments that do not create financial profitability are unacceptable. Even though the investment does not create financial profitability and has a lower expected return than the financial markets, sustainable investments are the main responsibilities in the development of our country, reducing unemployment, industrialization, development, transferring the corporate culture to new generations or keeping your values ​​alive.

WHAT IS EBITDA?

EBITDA  (Earnings Before Interests, Taxes, Depreciation and Amortization), which is an English term,  is an abbreviation of the concept of Earnings Before Interest, Depreciation and Taxes  (EBITDA).

Although EBITDA is not a financial measure recognized in generally accepted accounting principles (GAAP), it is a financial indicator  that is widely used in mergers or acquisitions of businesses in Turkey and allows comparison of profitability and operational efficiency between different companies. 

EBITDA  is the key indicator of the multiplier method, which is the valuation method of company value that we reach by multiplying the EBITDA of that company with the sector multiplier of the company .

HOW TO CALCULATE EBITDA?


EBITDA is found by adding (+) depreciation expenses (DA) to the main operating profit (EBIT)  in the company’s income statement   or by adding the relevant expenses shown in the formula below to the net profit for the period.

EBITDA = Net profit/loss for the period + Taxes Payable +/- Interest Expenses/Income +/- Foreign Exchange Difference Expenses/Income + Depreciation and Depreciation Expenses

EBITDA = Net income +/- Interest + Taxes + Depreciation + Amortization expenses

When calculating EBITDA, we will try to reach the operating profit by walking backwards from the Net Profit or Loss for the Period, that is, we will add expenses and subtract revenues to the net profit for the period. While doing this, it should be noted that the expenses we will add or the income we will decrease should not be related to the main activity of the company. Our aim is to eliminate income and expenses other than operational activities and focus only on the efficiency of companies’ operational transactions.

In addition, even if the income and expenses we take into account in the calculation are within the scope of operational activities, continuous, unsustainable, exceptional income and expenses should not be considered within the main activity income and expenses and should not be included in the EBITDA calculation.

Below is a summarized income statement. For ease of explanation, only operating profit/loss, net profit/loss for the period and EBITDA calculation are shown.

  • A-GROSS SALES
  • B-SALES DISCOUNTS(-)
  • C-NET SALES
  • D-COST OF SALES (-)
  • E-ACTIVITY EXPENSES(-)

OPERATING PROFIT OR LOSS

  • F- ORDINARY INCOME AND PROFIT FROM OTHER ACTIVITIES
  • G- ORDINARY EXPENSES AND LOSSES FROM OTHER ACTIVITIES (-)
  • H-FINANCE EXPENSES(-)
  • I-EXTRAORDINARY INCOME AND PROFIT
  • J- EXTRAORDINARY EXPENSES AND DAMAGES (-)
  • K- TERM PROFIT, TAX AND OTHER LEGAL LIABILITY PROVISIONS (-)

NET PROFIT OR LOSS FOR THE PERIOD

  • (-) ORDINARY INCOME AND PROFIT FROM OTHER ACTIVITIES 
  • (+) ORDINARY EXPENSES AND LOSSES FROM OTHER ACTIVITIES
  • (+)FINANCE EXPENSES
  • (-) EXTRAORDINARY INCOME AND PROFIT
  • (+)EXTRAORDINARY EXPENSES AND DAMAGES
  • (+) PROVISIONS FOR PERIOD PROFIT, TAX AND OTHER LEGAL LIABILITIES

=EBITDA

The method we will follow when calculating EBITDA should be as follows: in the income statement; To evaluate the transactions related to the company’s main activity within the EBITDA account by examining the accounts of ordinary income and profits from other activities, ordinary expenses and losses from other activities, financial expenses, extraordinary income and profits, extraordinary expenses and losses, period profit tax and other legal liability provisions one by one. We should try to reach the profit arising from the company’s main activity more clearly by eliminating transactions that are unrelated to operational transactions from the net profit/loss for the period.

WHAT SHOULD BE CONSIDERED WHEN CALCULATING EBITDA?

For example, we need to determine whether the transactions made are related to our main activity by examining the accounts under the “F- ORDINARY INCOME AND PROFIT FROM OTHER ACTIVITIES” account one by one in the income statement. If the transaction is related to our main activity, we do not need to make a change in the net profit/loss for the period, or we need to add the relevant income and subtract the relevant expense to the operating profit or loss account. However, if the transaction is not related to our main activity, we should add it if we have subtracted it, or subtract it if we have added it, when reaching the net profit/loss for the period.

The path we will follow when we examine the following items under this account is as follows;

Dividend Income and Ebitda from Subsidiaries

Dividend income has no relationship with our main activity, so we subtract these income from the net profit and loss for the period.

Outdated Provisions and Ebitda

The issue is whether the obsolete provisions account will be excluded from the net profit for the period. This account is the income arising from the cancellation of provisions, and as long as it arises from the main activities of the company, we take it into account in the EBITDA calculation, that is, we do not need to take any action since it is already calculated in the net profit / loss for the period.

Interest Income and Expenses and Ebitda

Interest Income and Expenses  In principle, interest income and expenses are eliminated when calculating EBITDA. However, if companies evaluate their cash from sales during the period from collection to payment within the working capital cycle due to their activities, until the relevant payment is made, they are taken into account in the EBITDA calculation and are not eliminated.

Exchange Difference Income and Expenses and Ebitda

Exchange Rate Difference Income and Expenses:  In principle, foreign exchange difference income and expenses are eliminated when calculating EBITDA, but foreign exchange difference income and expenses arising from the main activities of companies are taken into account in the EBITDA calculation and are not eliminated. For example, exchange rate difference income and expenses arising from trade receivables and payables are included in the EBITDA calculation, but exchange rate difference income and expenses arising from foreign currency bank loans or other financing activities should not be taken into account in the EBITDA calculation.

If foreign exchange difference income and expenses arise due to an extraordinary situation in the relevant period, these income and expenses should not be taken into account in the EBITDA calculation as they are not sustainable, even if they are related to the main activity. For example, the exchange rate difference that occurs in situations such as rapid exchange rate increase or devaluation.

Maturity Difference Income and Expenses and Ebitda

Maturity Difference Income and Expenses  Maturity difference income and expenses to be accrued for the sale of goods and services should be taken into account in the EBITDA calculation since they are related to the main activity of the companies. Even though maturity difference income and expenses are accounted for in other income, interest income or financing expenses accounts, they should not be eliminated when calculating EBITDA.

Rediscount Income and Expenses and Ebitda

Rediscount Income and Expenses  Rediscount income and expenses are discounted to the present value of trade receivables and commercial payables with a certain discount rate. Rediscount income and expenses must be taken into account in the EBITDA calculation.

Term Tax and Deferred Tax Income/Expense and Ebitda

Term Tax and Deferred Tax Income/Expense,  Term Profit Tax and Other Legal Liabilities Provisions and deferred tax income/expense should not be taken into account in the EBITDA calculation. We must add the taxes to be paid, which we subtracted when reaching the net profit/loss for the period, to the net profit/loss for the period.

Extraordinary Income and Expenses and Ebitda

Extraordinary Income and Expenses  are not taken into account in the EBITDA calculation in principle, but as long as they are sustainable, they should be taken into account in the EBITDA calculation.

Severance Pay and Unused Leave Provision Expenses and Ebitda

Severance Pay and Unused Leave Provision Expenses  Severance pay provision expenses are included in the EBITDA calculation within operating expenses and therefore within operating profit/loss. Therefore, there is no need to take any action, but in TFRS calculation of severance pay provision, current period service cost, past service costs and net interest on the defined net benefit liability (asset) are recognized in profit or loss. Service costs are accounted for in operating expenses, and interest expense is accounted for in financing expenses. Therefore, when calculating EBITDA, financial expenses related to severance pay should be included in the calculation, that is, added to the net profit/loss for the period.

Actuarial gains and losses are recognized in other comprehensive income, so they will not affect the profit/loss for the period and therefore the EBITDA calculation, so there is no need to take any action.

Translate »